Ambergris Caye – Your Guide
Welcome to my Ambergris Caye Guide. As the largest island and most visited spot in Belize, there are so many options here - hotels, bars and restaurants, attractions, hang-out spots, shops, and dive & snorkel sites. I hope to give you an overview in this guide, to get you started, and then you can get into more detail in my posts and articles.
I've lived on Ambergris Caye Belize, full-time, since 2007 and I find there is still so much to discover on my favorite island in the world. It's one of my favorite things about living here.
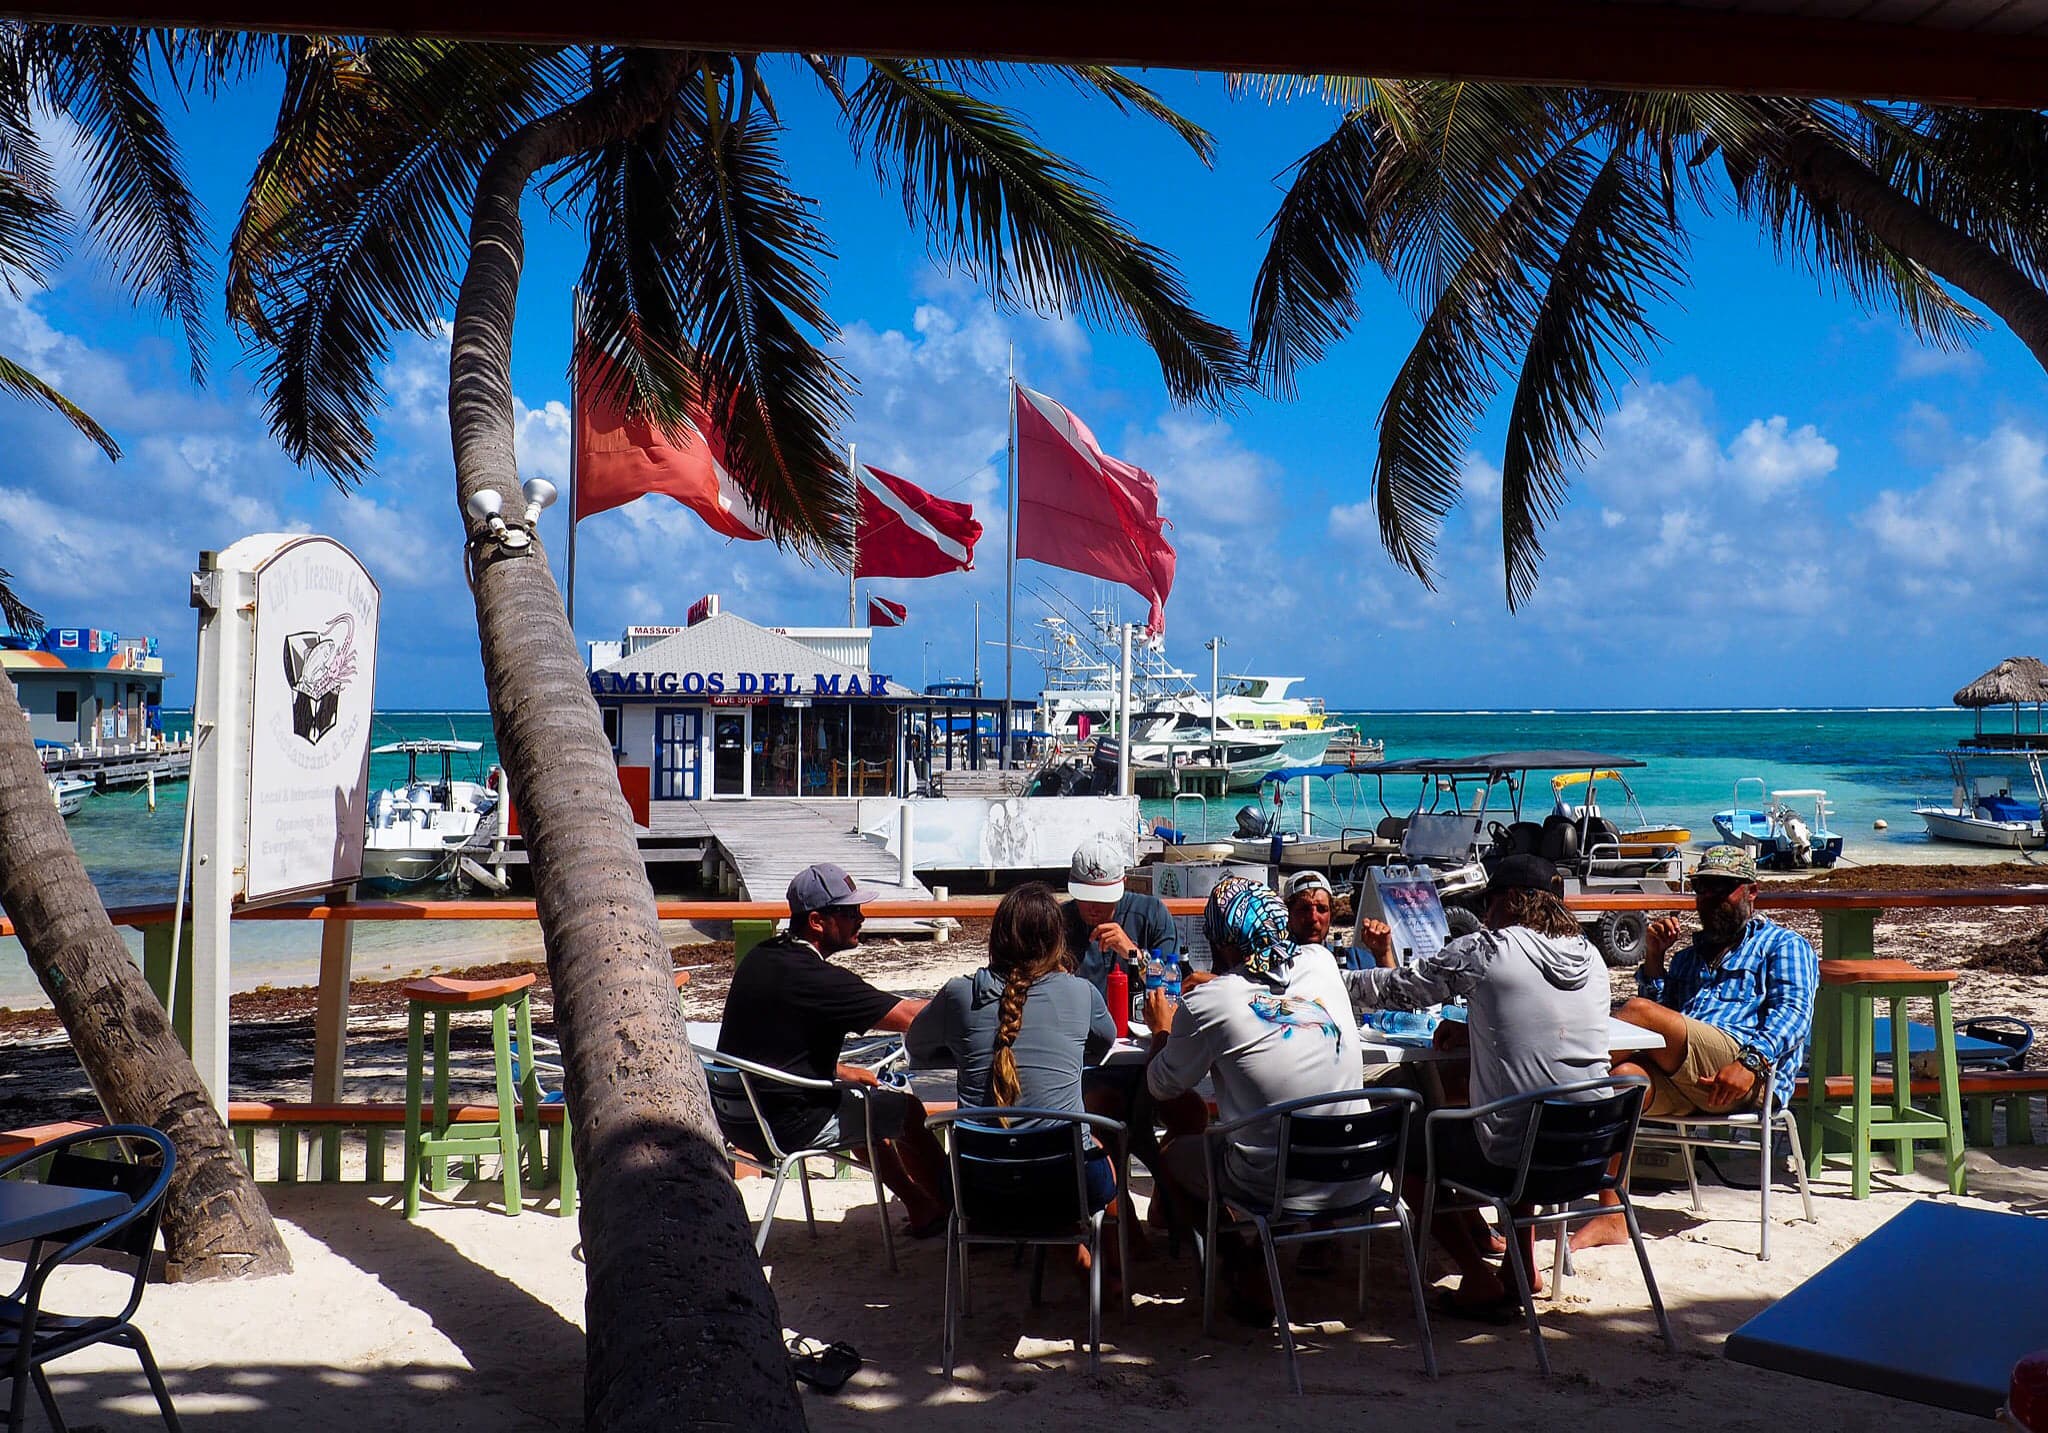
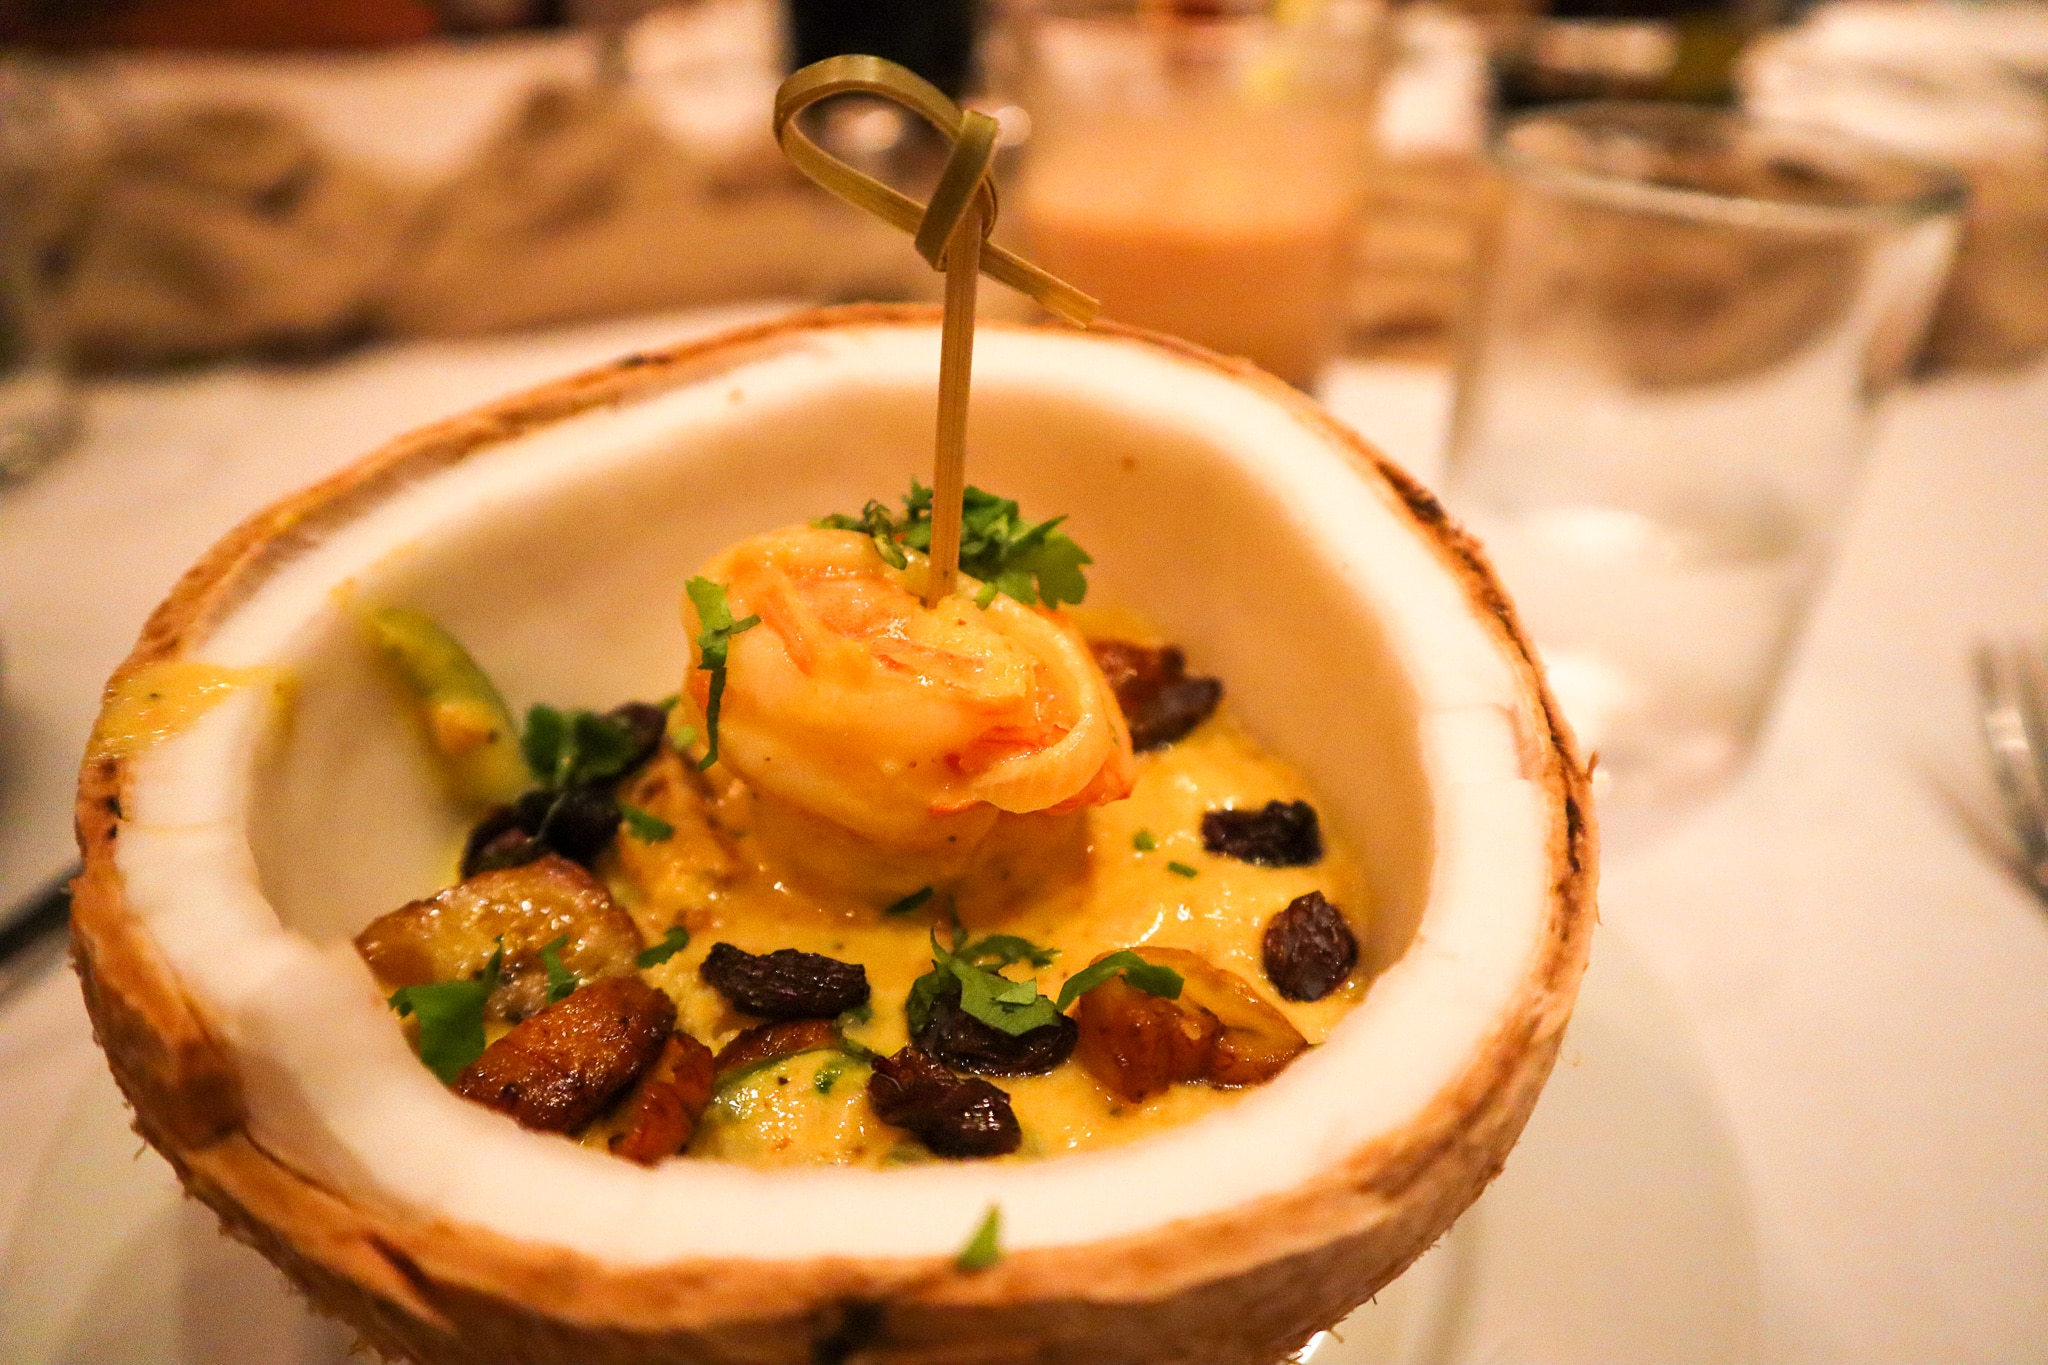
Lunch at Lily's Treasure Chest
On this website, you'll find the events, the happenings, the fun things to do, and some of the more mundane but necessary details like grocery shopping or renting a golf cart. I share LOTS of pictures and updates on my daily island life so that you can get a taste of what it is like to visit AC and what it is like to live here. For all my weekly posts about Ambergris Caye, click here.
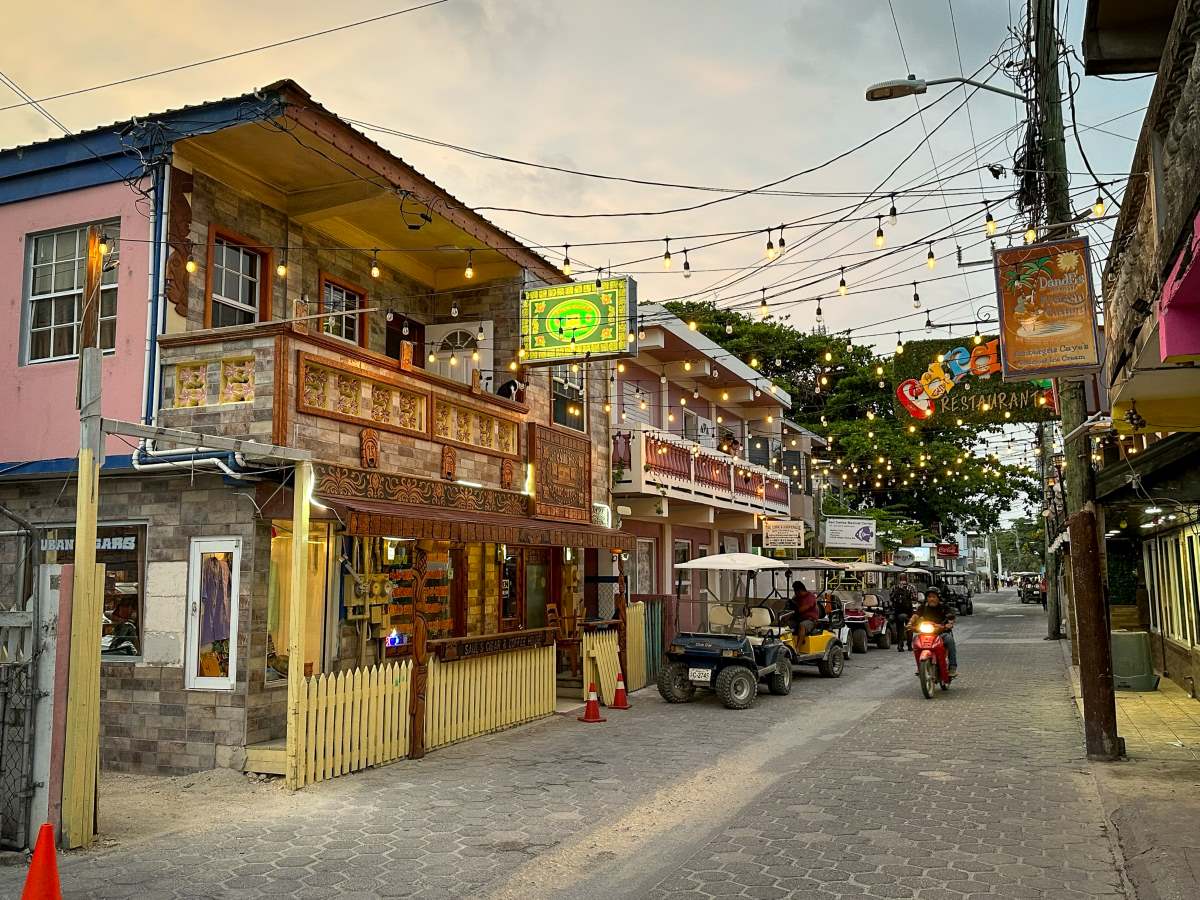
Middle Street, San Pedro at sunset
An Overview of Ambergris Caye
Just off the coast, in the very north of Belize, is Ambergris Caye, the largest of the hundreds of cayes ("keys") scattered up and down the country's coast. Ambergris is about 25 miles long - the largest island in Belize by a long shot - but is never more than a few miles wide.
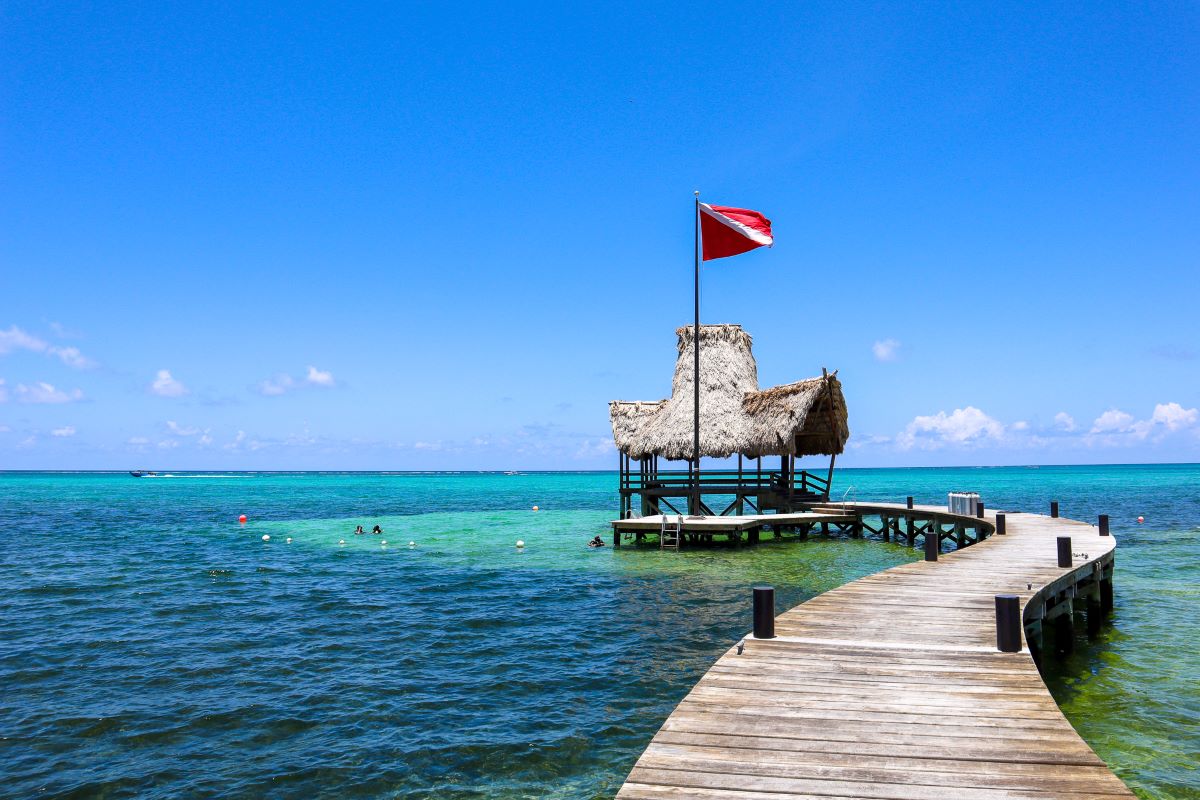
Many people travel to Belize to snorkel, fish, and SCUBA dive and Ambergris Caye offers some of the easiest access to the 2nd largest barrier reef in the world. (You can see the waves breaking over the reef all along the shore). World-class snorkeling and diving sites are generally just minutes away from the island.
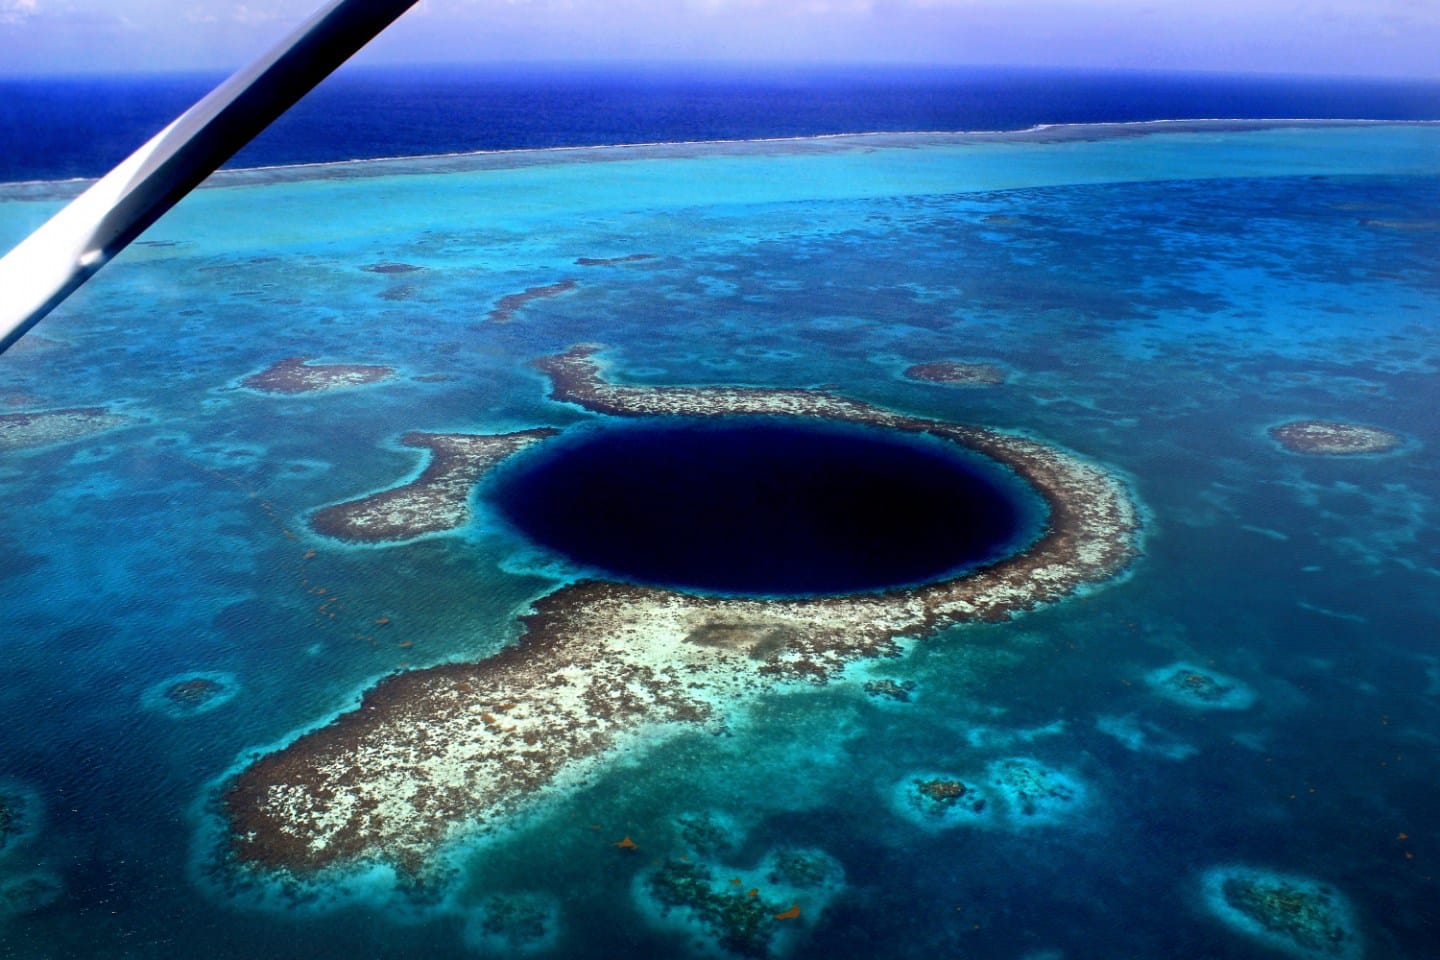
You do not need to be certified or an expert in the water. I'm not suggesting first-timers need to dive into the depths of the Great Blue Hole (about 1.5 hours by boat from Ambergris Caye) but EVERYONE should snorkel at least once while you are here. But I'll get to that in a second!
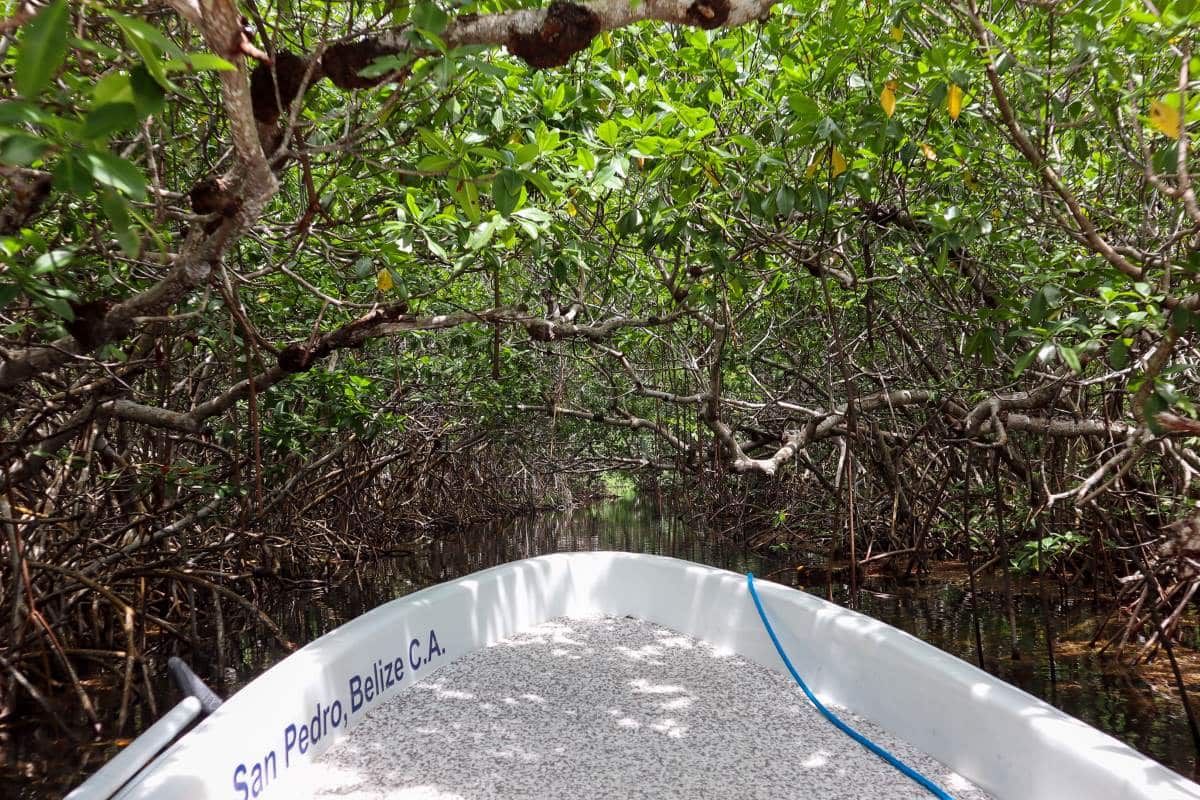
Ambergris Caye may be just one island, but she has many different faces. The far north is home to Bacalar Chico National Park and Marine Reserve, a protected area with incredible wildlife and ancient Maya history. You can take an all-day boat trip to explore the mangroves, the waterways and the narrow canal that separates Belize from Mexico's Yucatan peninsula.
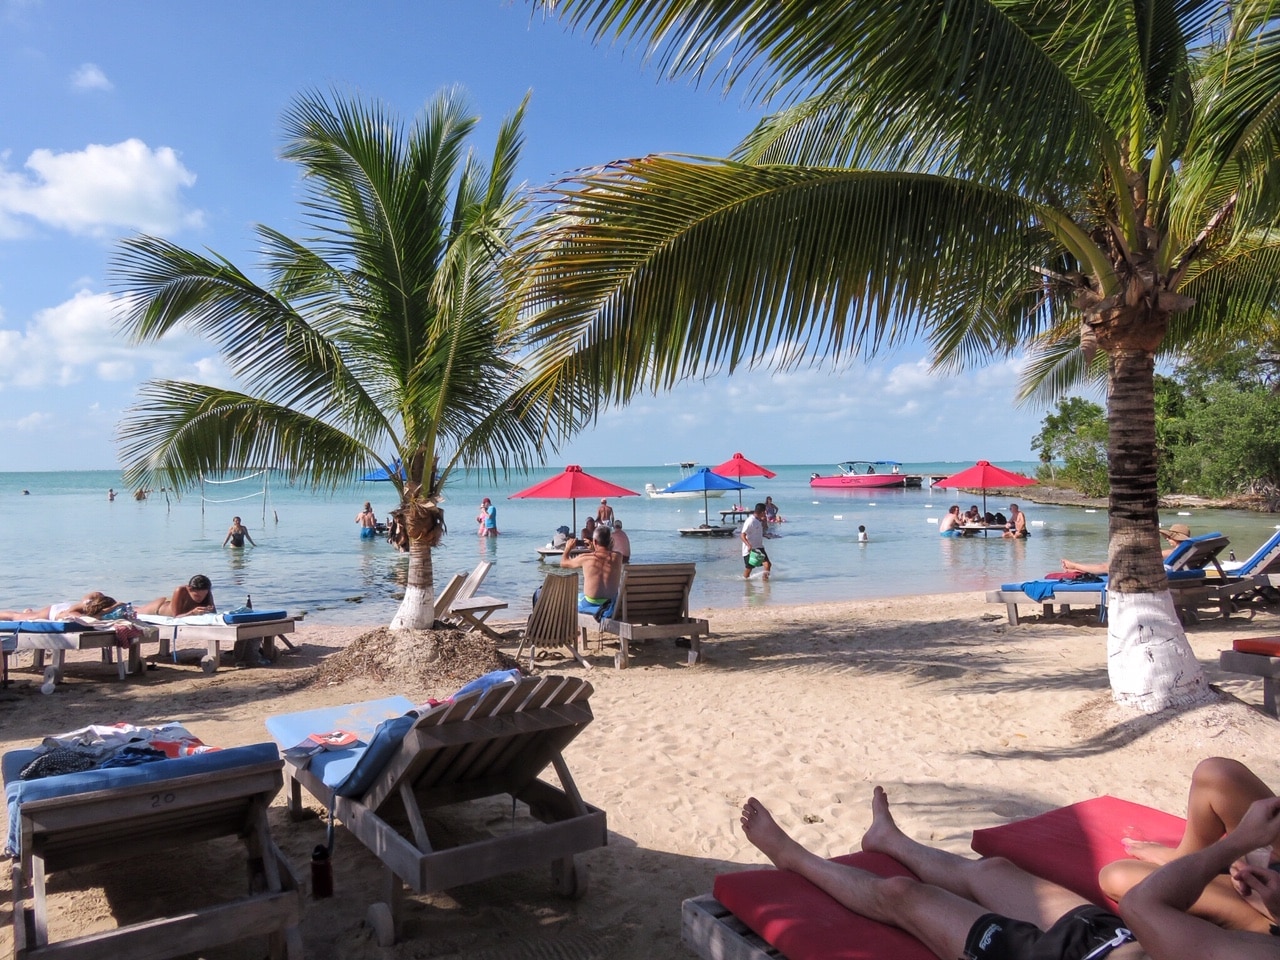
On the west side, you'll find Secret Beach – a must-see spot with calm, crystal-clear waters. The word "Secret" is, at this point, tongue-in-cheek. The small stretch, which 10 years ago was basically deserted, is now packed with beach bars and restaurants.
But I think there is something for everyone there - and there is no trip to Ambergris Caye without a bumpy ride out to Secret Beach. It's an adventure! Rewarded with a rum punch and a float in the water. It's quite shallow and calm - perfect for kids and adults - and you can walk out for hundreds of feet along the sandy bottom. (You can see some 2014 pictures of a barless Secret Beach and how BAD the road north was in this post)
You can get my current Complete Guide to Secret Beach here.
The east side/the reef side of the island is where most of the action is happening. You'll discover Ambergris Caye's only town – San Pedro. Town is where you will first land (either by plane or water taxi) and where you'll find lots of the resorts, hotels, and homes enjoying cool sea breezes and gorgeous ocean and reef views.
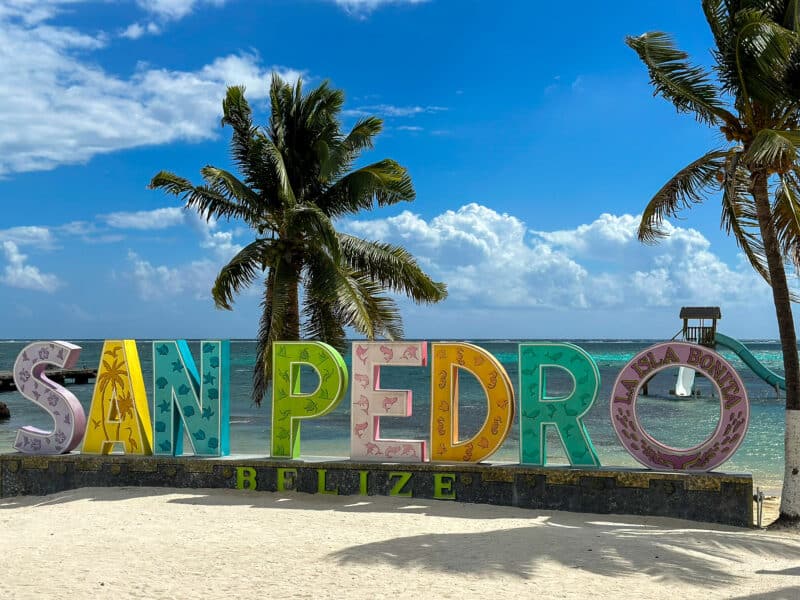
Let's talk more about Ambergris Caye's only town - San Pedro. Named after the patron saint of fishing - St. Peter.
San Pedro Town
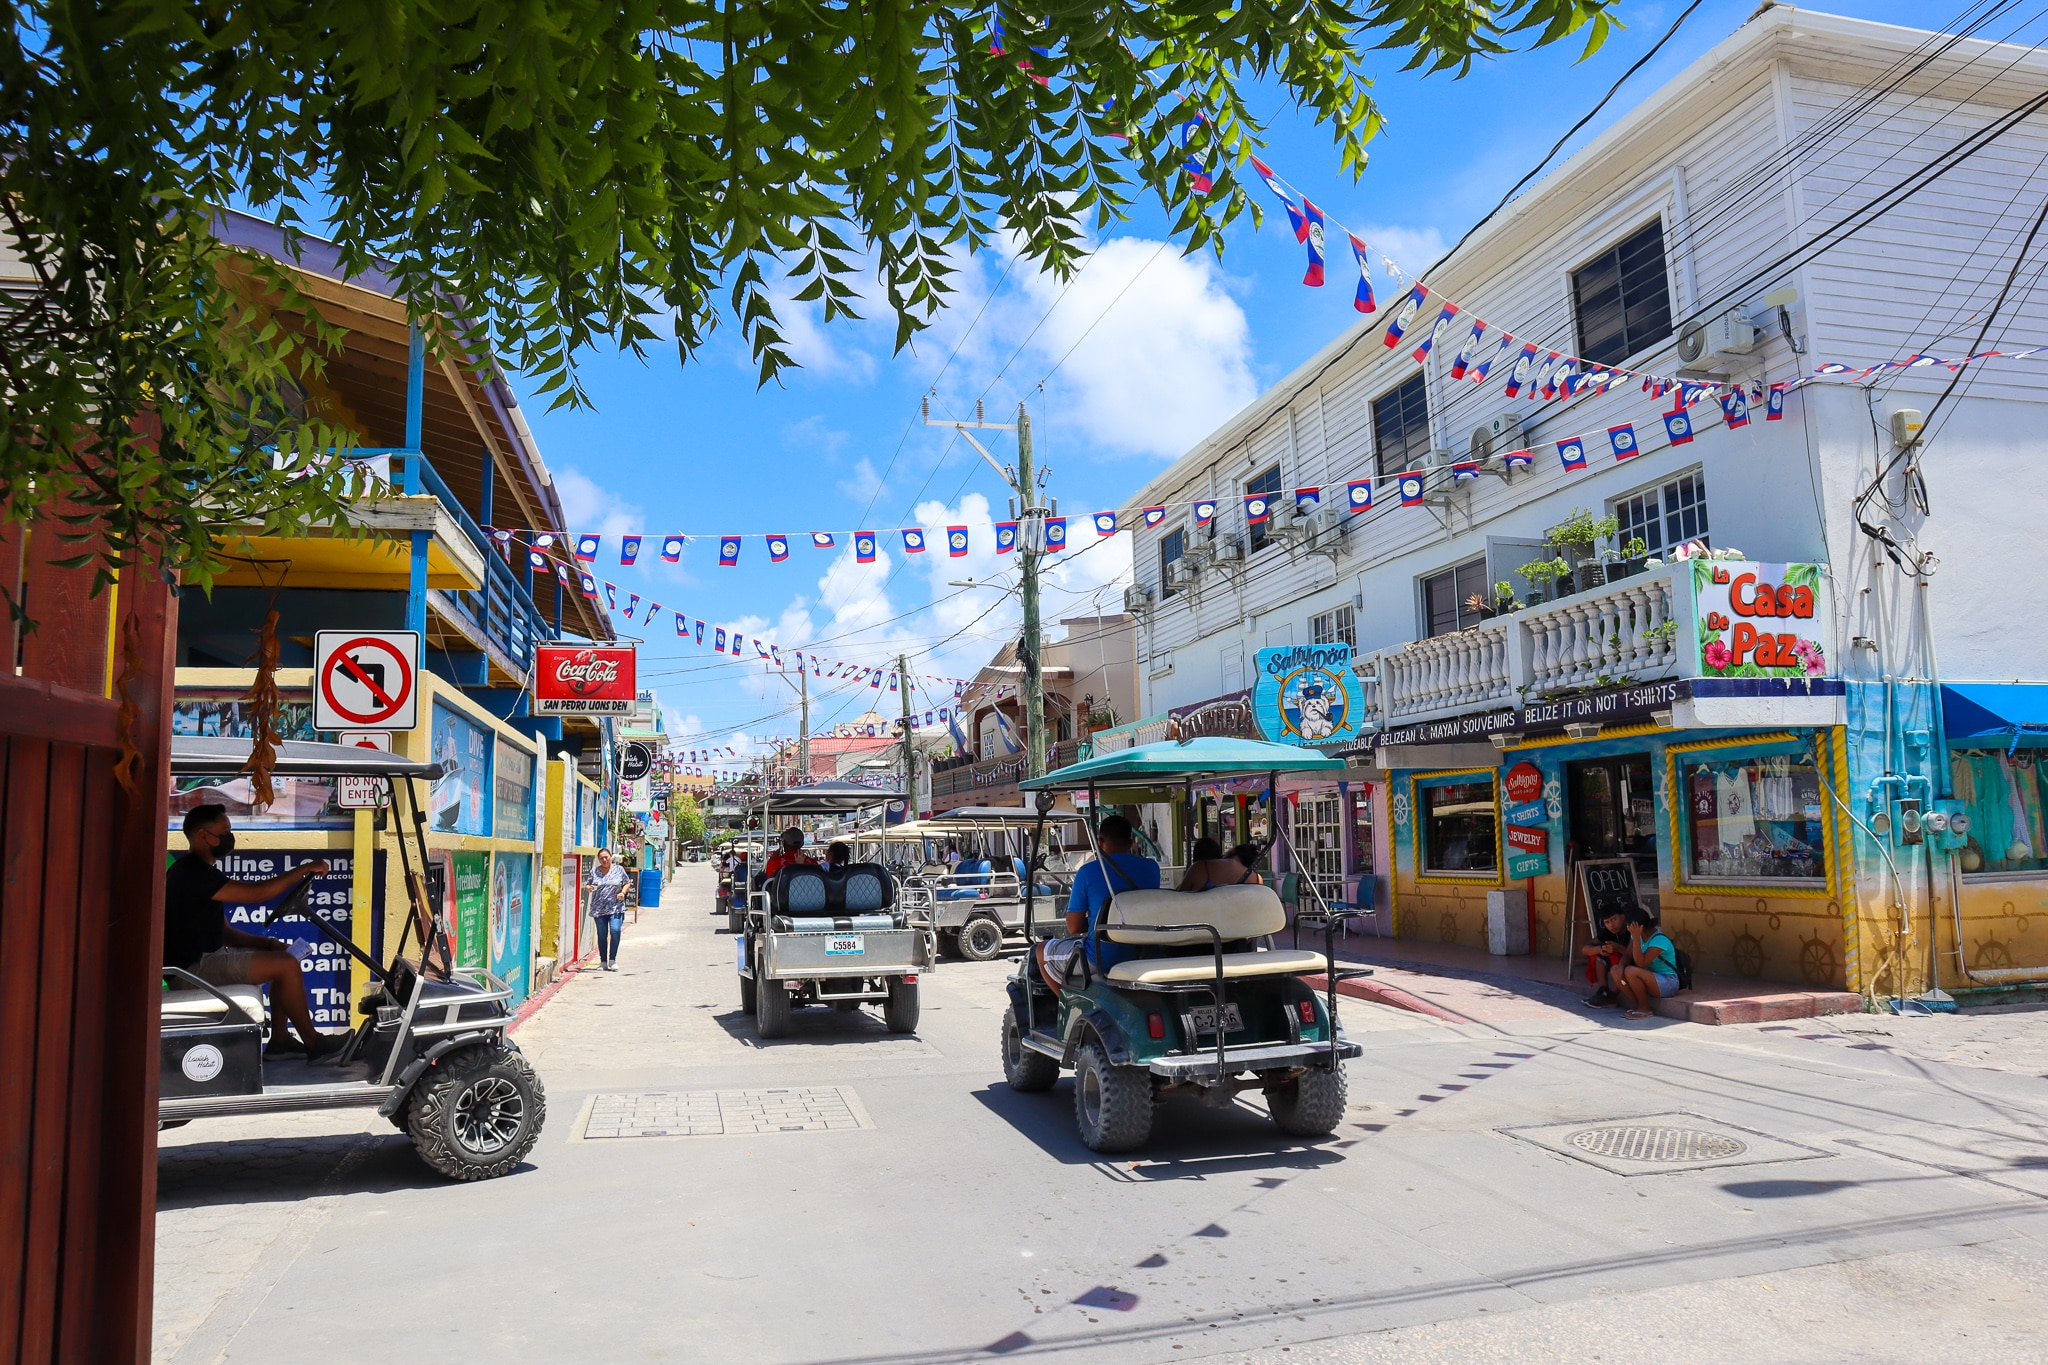
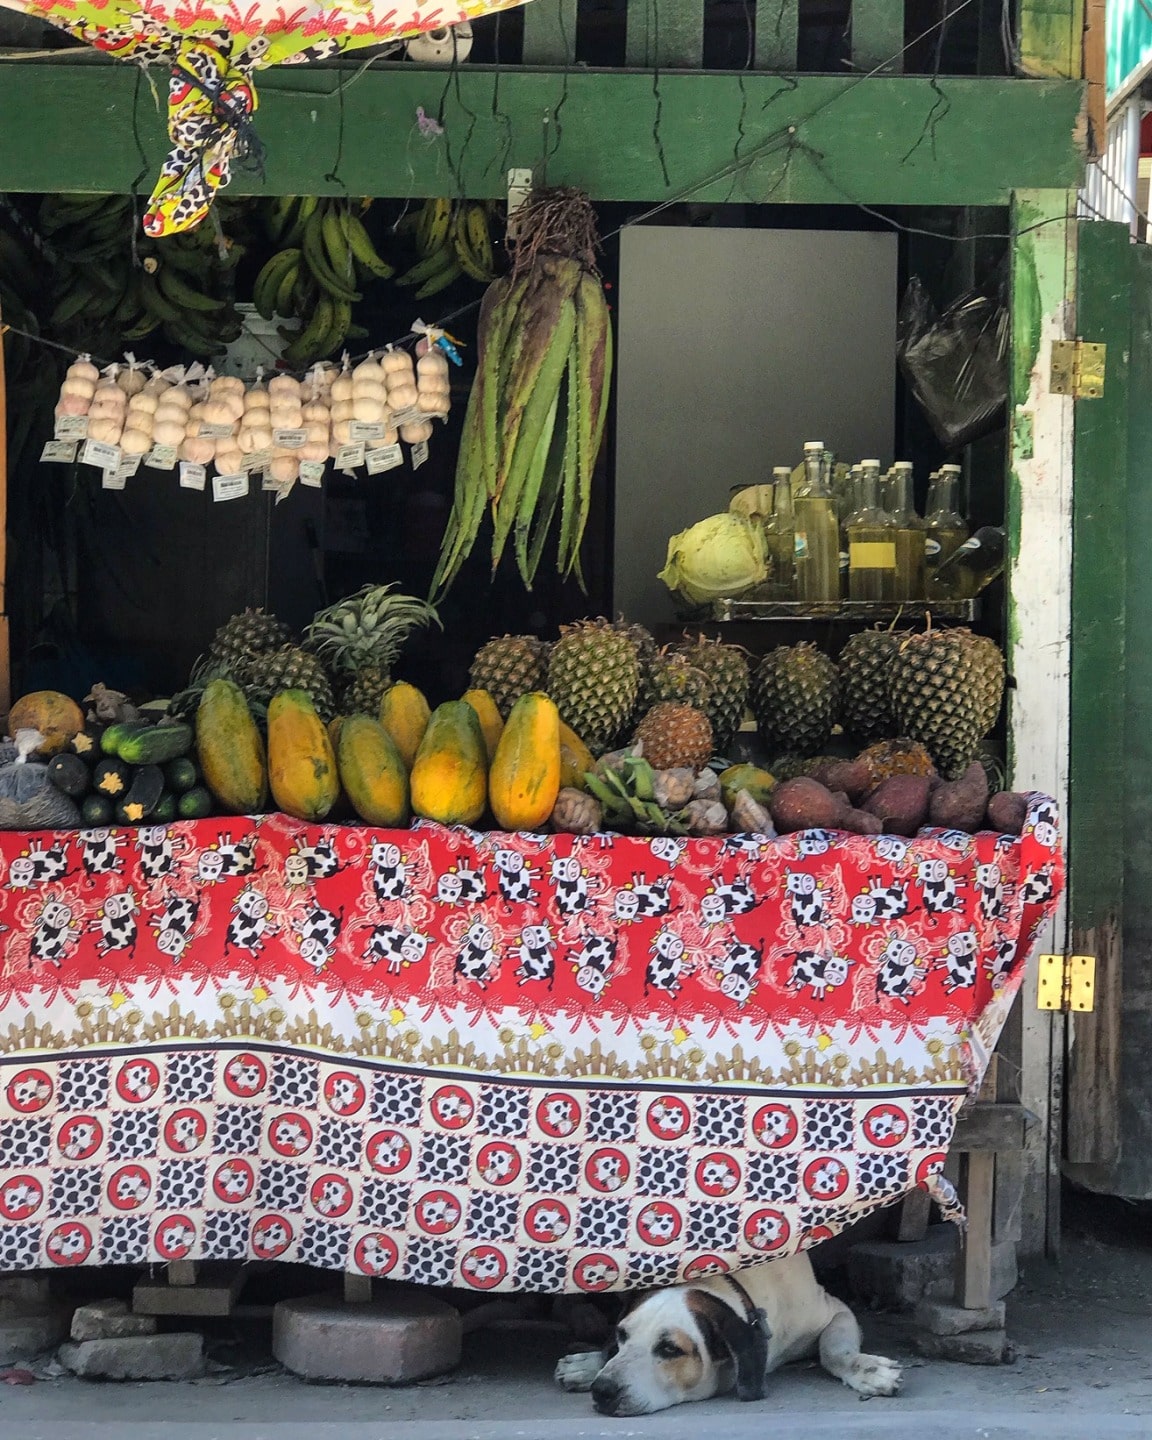
San Pedro town is the traditional hub of the island and it wasn't long ago that just about everyone lived in or very close to what was then a tiny fishing village with few vehicles and sand streets. Despite how busy it is getting, San Pedro can still feel very much like that little village. You'll often see bicycle vendors selling Creole buns or ice pops. You'll find dogs lying in the sun on the side of a busy road. Or perhaps taking themselves for a swim in the ocean.
But as tourism grows, so does the population, and now you can find lots of resorts and lodging up to 3 or 4 miles south of San Pedro town and up to 15 miles north. Homes and hotels and resorts, all enjoying the cool ocean breezes and the incredible ocean views.
Things to Do on Ambergris Caye, Belize
Ambergris Caye is the most popular tourist destination because of its stunning natural beauty, glowing aqua waters, barrier reef that you can see from the beachfront, and abundant life under the sea. The island offers a huge selection of accommodations, luxury resorts, amazing restaurants, and lively nightlife.
A good place to start - to get a sense of what there is to do here: 12 Must-Dos on Your First Trip to Ambergris Caye.
You can try a different restaurant for each meal and enjoy live music pretty much every night at a different beach bar or hang out.
Check out my Days of the Week calendar for the weekly events on Ambergris Caye.
For an amazing overview of the food of Belize and the layout of San Pedro town, try Belize Food Tours. You and your group will walk around San Pedro - tasting popular dishes at some of San the town's best restaurants. It's a perfect tour to start your vacation.
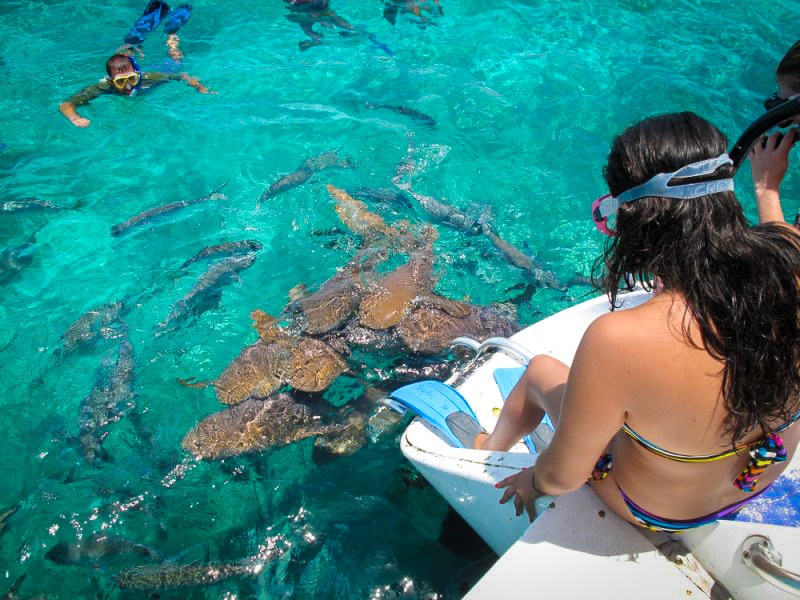
Hol Chan Marine Reserve is a must for absolutely everyone who visits Ambergris Caye (or Caye Caulker) - no matter what your experience is in the water. It's generally a 2-stop snorkel trip. The first stop is Hol Chan (which means "Small Cut" in Maya) for snorkeling around and over the reef. You see tons of fish, rays, eels and sometimes...even a manatee. The second stop is the famous Shark-Ray Alley where when you spot a tangle of sharks...it's time to jump in.
Seriously! It's amazing.
We've got fun over-the-water bars, sports bars, we've got fun beach club lounge all day spots (Moon Bar is a fun get-away on north Ambergris)...
We have world-class fly fishing (in fact, my boyfriend runs an off-the-grid flyfishing camp and I'm there quite a bit). We have coffee shops, over-the-water yoga, karaoke, live music, trivia nights, hermit crab races, and the World Famous Chicken Drop.
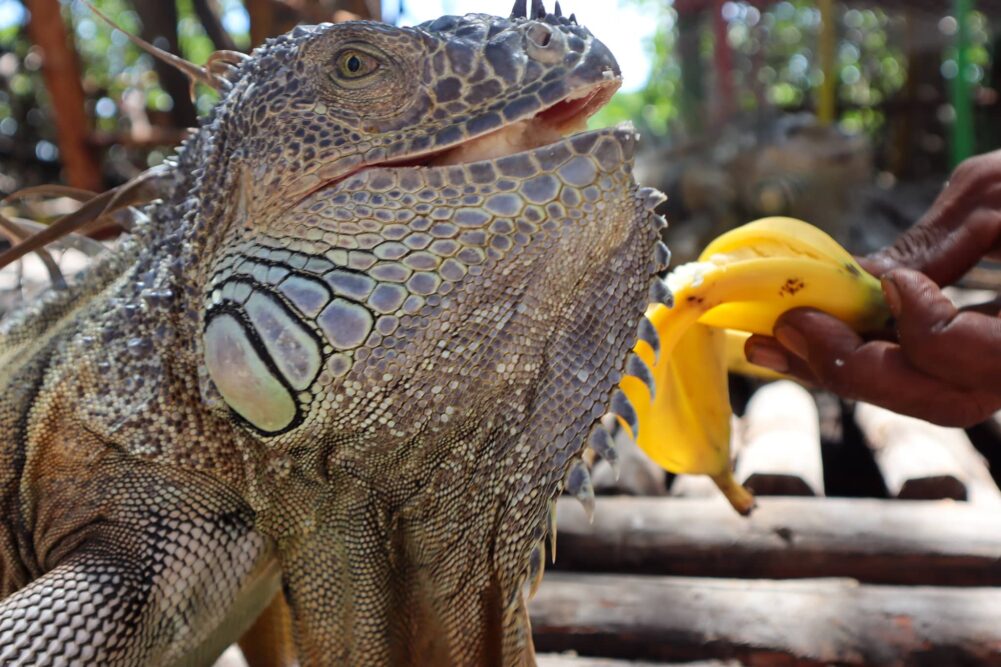
We have a very cool green iguana sanctuary right in the middle of town.
I hope you are picking up what I am laying down...you can do as much or as little as you want on Ambergris Caye. You have options - lots of them.
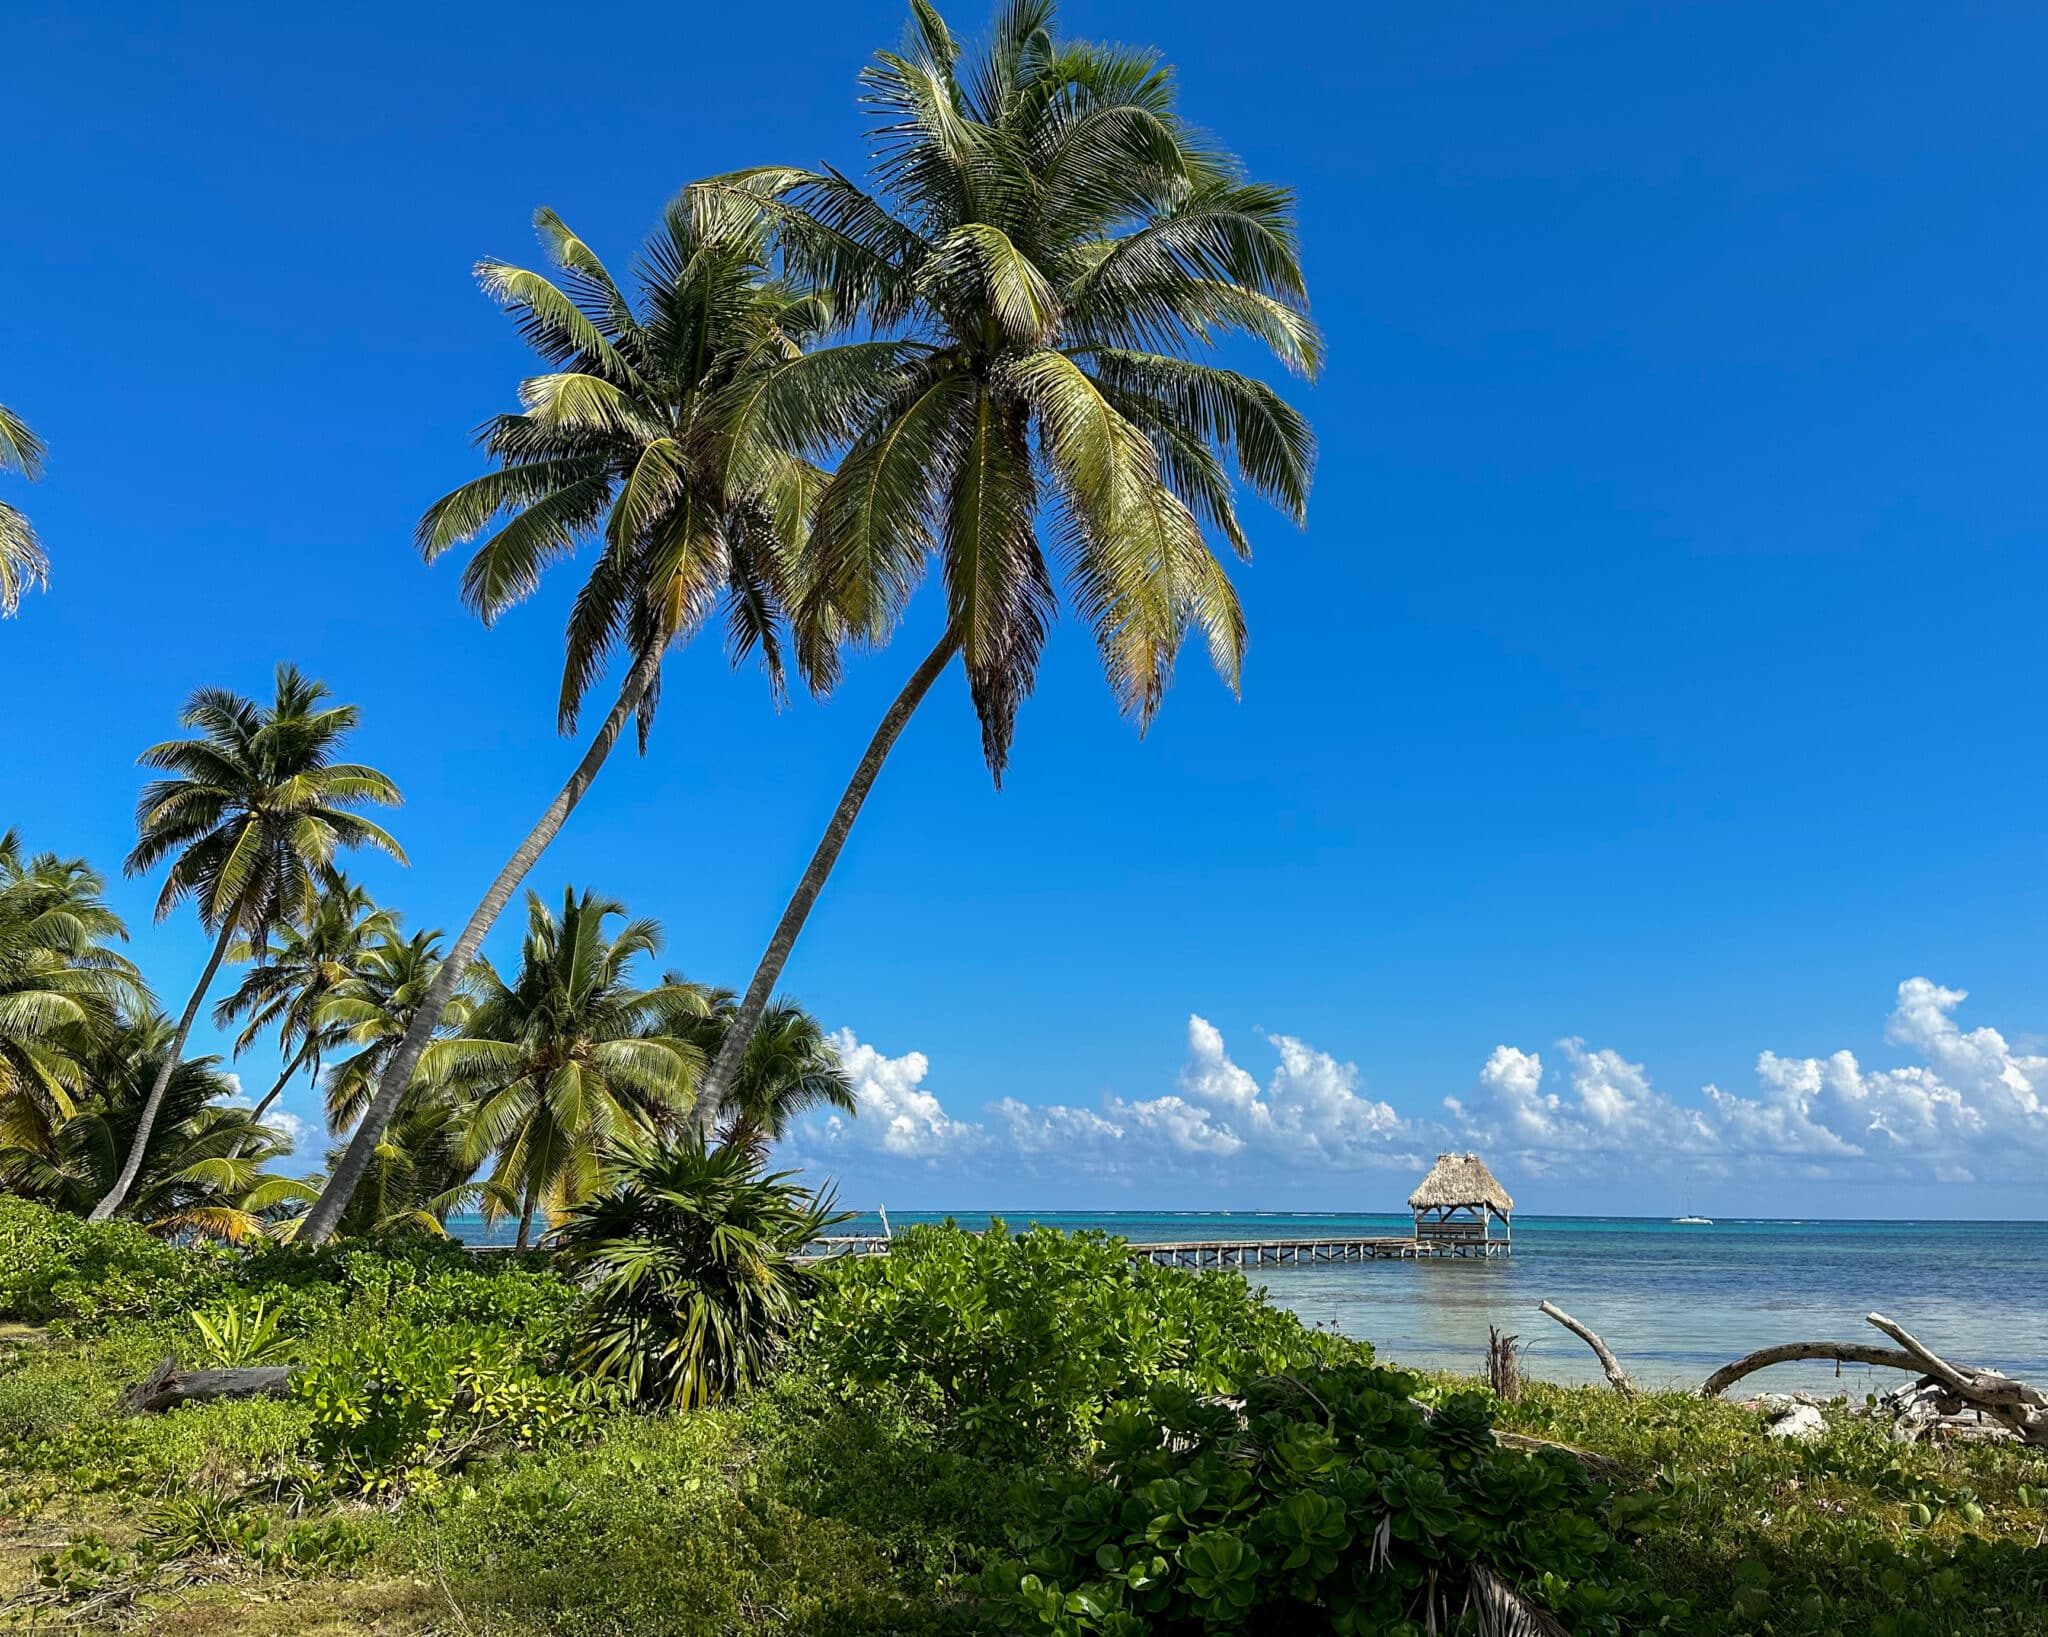
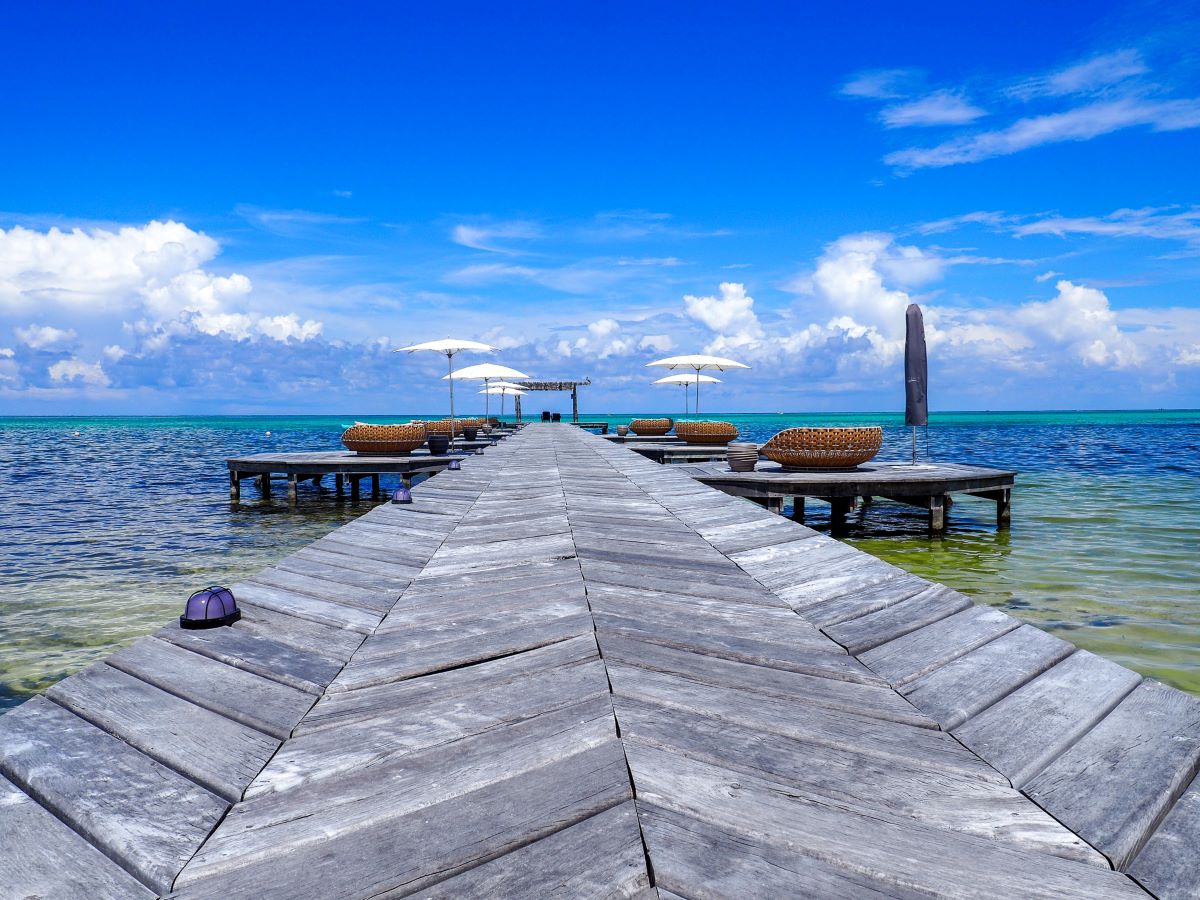
The dock at Ramon's Village Resort
Check out this section of my website for updates on Fun Activities and Tours on Ambergris Caye.
For a look at weekly events in San Pedro - check out my calendar.
And for even more - all my favorite things to do on the island...you can buy my book 50 BIG Experiences on Ambergris Caye on Amazon.
When to Visit Ambergris Caye
The perfect time to visit Ambergris Caye? Well, that depends on you.
If you're looking for ideal weather - dry and sunny, January to April is your best bet. But there's no wrong time to visit...
It's a question very particular to you! It's often about when you have time off to visit Belize. Maybe you want to visit during the San Pedro Lobster Festival. Sure, it will be warmer in July, but it's such a fun party to attend especially if you love LOBSTER.
Or maybe you are thinking of moving to Belize and maybe even opening a business - you probably want to check out the "slow season" - September and October. It's a great time to visit the island at its quiet, least busy time. You'll probably find some great hotel deals - maybe even that fancy one you were dying to try - and perhaps you can time your trip to coincide with Belize's BIG Independence Day celebrations. (Here is a more in-depth explanation of what to expect in "Rainy Season" and what to pack.)
Or what about Christmas in San Pedro - so laid back and pretty. Or May or...a laid-back, no-cooking-for-you Thanksgiving? I guess what I am trying to say is that there is no wrong time to visit Ambergris Caye. That's the beauty of our island. There is always something going on.
Where to Stay on Ambergris Caye
Ambergris Caye is the most popular place to visit in Belize and - not surprisingly - has the broadest range of lodging to pick from. There are smaller cabanas far from town, gorgeous, modern condos, fantastic resorts, and private rental homes...I can not just recommend one or even five! There is something for most budgets...in fact, many many options. Browse through my Ambergris Caye Hotels & Lodging page to get my full scoop about my stays at different spots around the island. I think it is an excellent place to start.

Where to Eat on Ambergris Caye
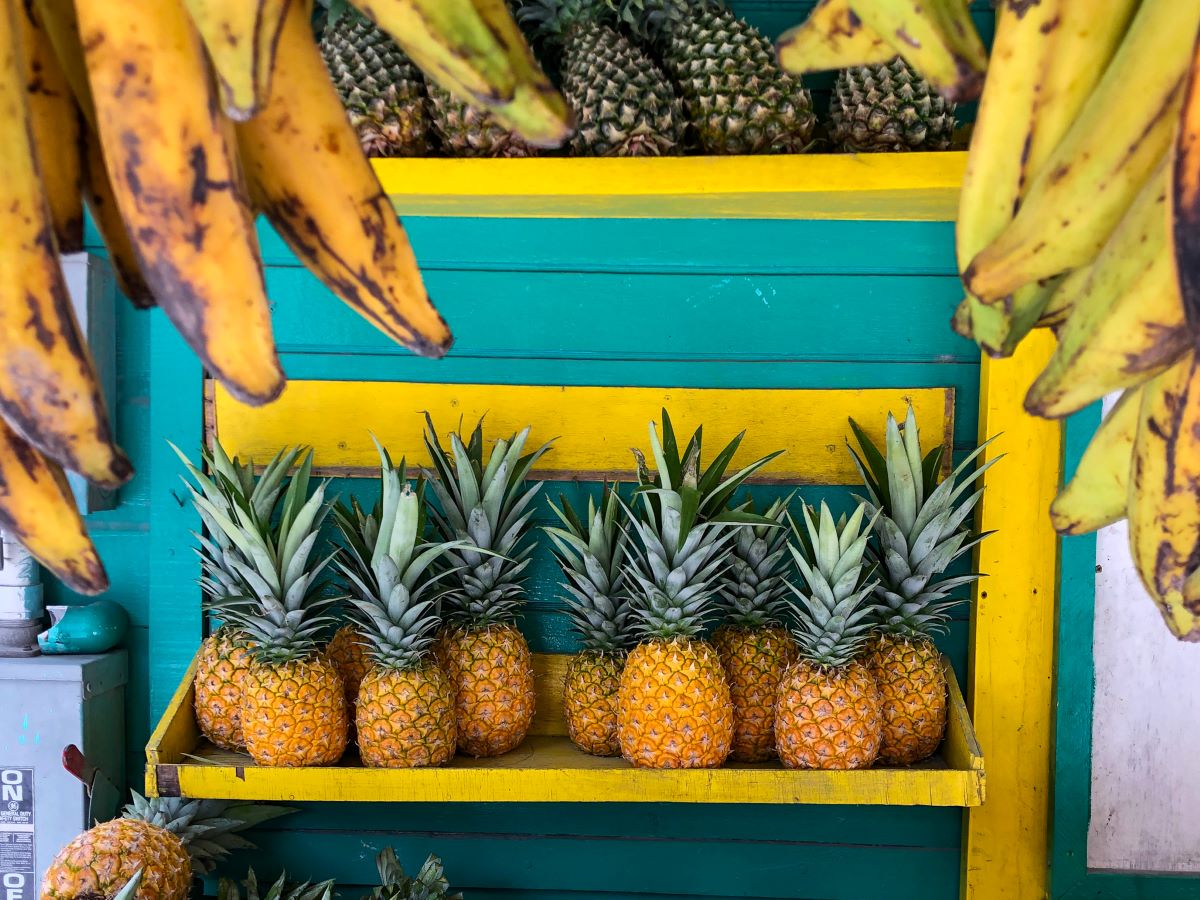
At last...we are on my favorite subject. Food...but more than just food - Belizean food.
You probably don't know very much about the food of Belize. I didn't know one thing before I first visited San Pedro in 2006. But I was quickly smitten with some of the classic Belize dishes and, even more specifically, San Pedro-based food.
Fresh ceviche, conch fritters, stone crab and lobster, whole fried hogfish, stewed chicken with rice and beans - the dishes tend to be simple and totally delicious.
Mmmm....coconut curry at one of my trips to Elvi's Kitchen.
A fantastic way to get a sense of what San Pedro offers, food-wise, is Belize Food Tours. They do a 2-3 hour lunch walking tour throughout town. It gives you a taste of all sorts of local specialties - food, desserts, treats, and drinks - and it's a great way to get a lay of the land.
San Pedro can be busy! The streets packed with golf carts, bicycles, school kids, and sometimes dogs can seem a bit overwhelming at times. It's nice to walk around with a guide and ask all the questions...
To scroll through some of the restaurants where I've eaten - including my favorites on the island - check out my section on The Restaurants of Ambergris Caye.
Shopping on Ambergris Caye
You will find most of the shops - the larger grocery stores and the gift shops - in or near San Pedro town. But almost every neighborhood has a small shop for cold drinks and the basics. You can read more about grocery shopping on the island, check out some of the local prices and get some tricks and tips here.
Something to remember when you are looking at food or liquor prices, anything imported is going to cost more - almost certainly more - than it costs in the US. Import costs, refrigeration costs (where necessary), duties, and taxes. Buying and eating locally grown foods, though somewhat limited, are by far the cheapest option!
Now let's talk about gift shops - some of my favorite spots to pick up something pretty on the island. Belize has beautiful carved items made from our local hardwoods - and you can find a fantastic collection at Graniels Dreamland on Middle Street, San Pedro.
Absolutely walk around the Artisans' Market on Back Street for a wide range of goods made in Belize and in neighboring countries. Art, baskets, carvings, jewelry...I always find something I want!
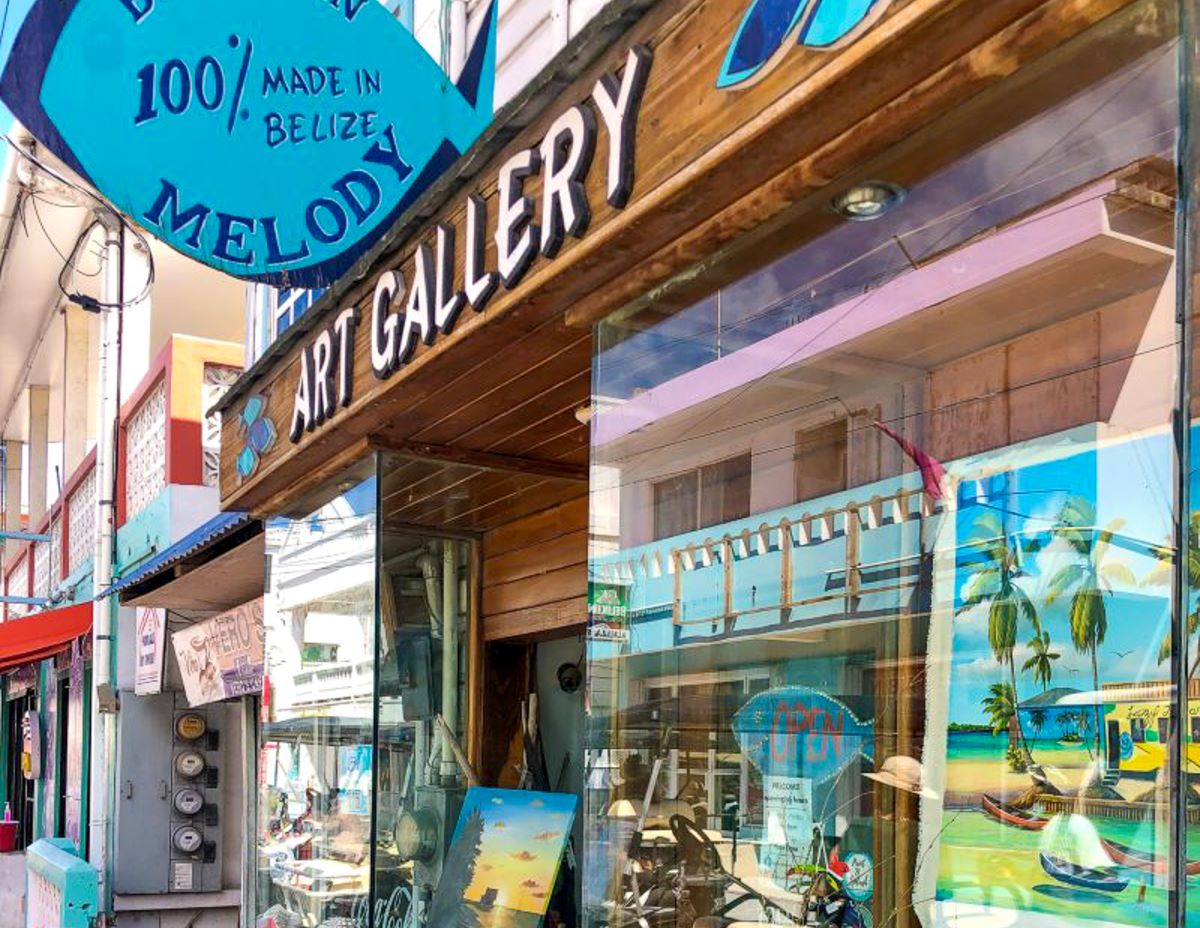
Stop and have an iced coffee and a look around my friend Saul's Cigar & Coffee House- he's got some gorgeous hand-carved items and very pretty painted hats. Or to admire the beautiful artwork, Belizean Arts and her sister shop - 501 Gallery. Belizean Melody's Art Shop is also a must-visit for the perfect gift or souvenir. I LOVE buying art on vacation. Something you can still use and enjoy 10...or 15 years later. And it will always remind you of San Pedro.
Here are all my favorite spots to shop for great souvenirs on Ambergris Caye.
Getting to Ambergris Caye
Ambergris Caye is an island - so you are going to need to take a plane or a boat from the mainland. Our one international airport is located outside of Belize City on the mainland. And if you are searching for Ambergris Caye airport or San Pedro airport...it's called the airstrip. Just one runway...for getting on and off of Ambergris Caye.
For information about the cheapest way to reach Ambergris Caye (water taxi), the most scenic route (plane), and the fastest route (definitely plane!) - you can read this post with all information about connecting from the international airport to the island.
Some people chose to travel to Belize by flying into Cancun airport - to enjoy Mexico first or to take advantage of sometimes cheaper ticket prices. For more information on that route - CUN to Ambergris Caye, check out this post.
Now let's talk about...
Other Frequently Asked Questions (FAQs):
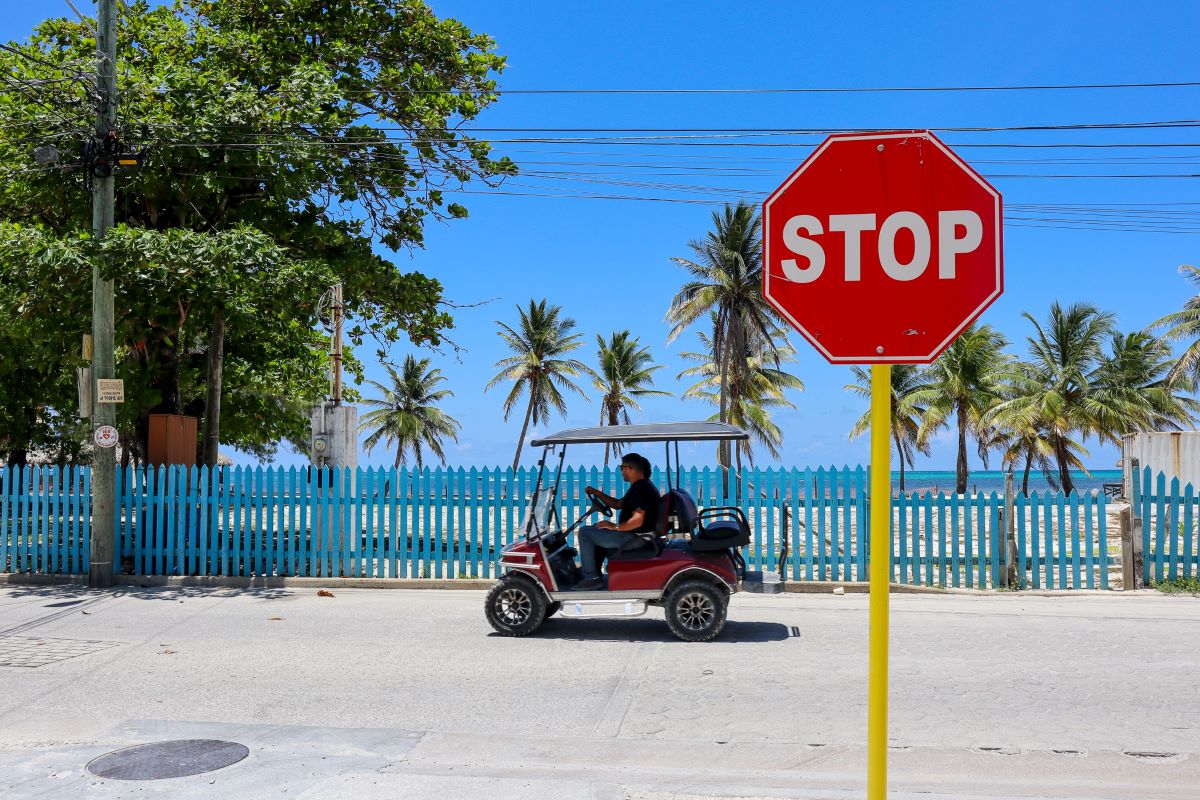
- Should I Rent a Car on Ambergris Caye? No. It's not even an option. Cars are generally used for business uses (construction, deliveries) and taxis only. If you are looking for wheels, you are looking to rent a golf cart.
- Should I Rent a Golf Cart On Ambergris Caye? My short answer is yes! Ambergris Caye is a big island that you'll want to explore - head over to Secret Beach, check out the restaurants in San Pedro town, hit the beach bars in the Boca Del Rio area. You might want to start with a few days or you might want to rent for your entire week. Here is an article about this exact subject that will help.
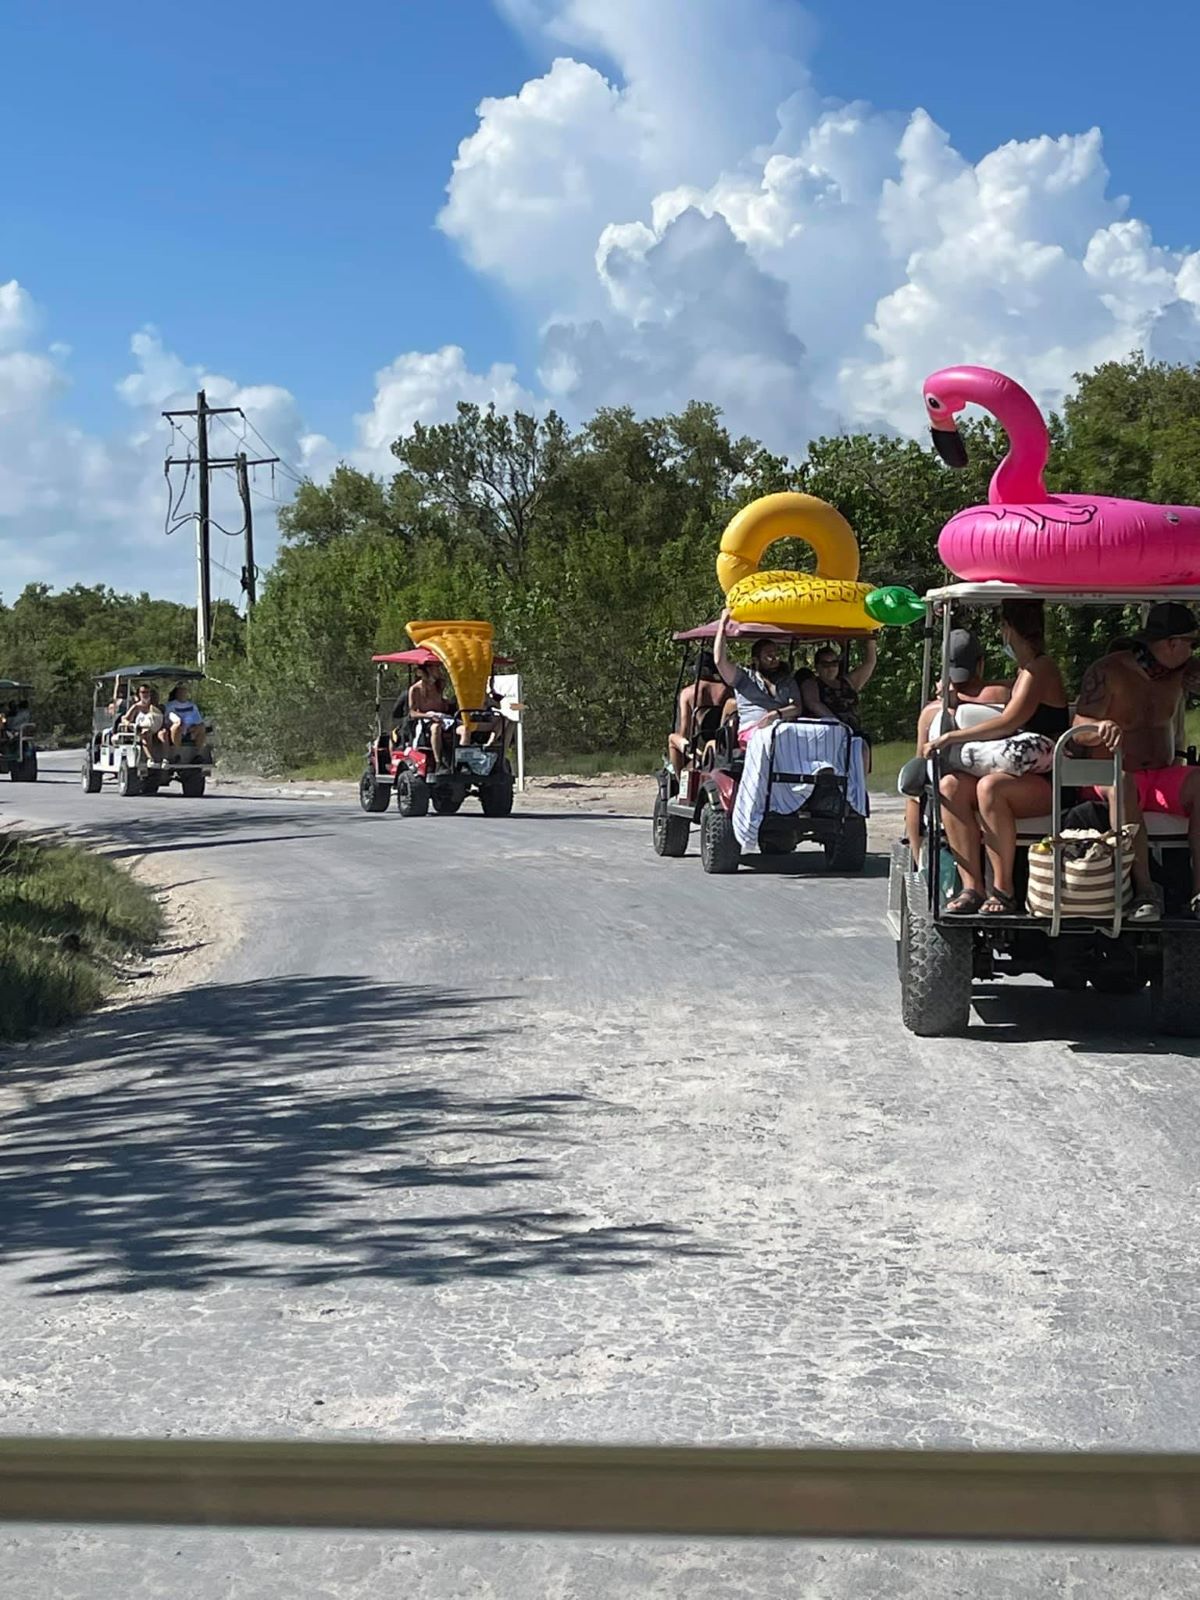
Golf Carts heading to Secret Beach
- What type of money is used on Ambergris Caye, Belize? What about ATMs? What are the customs/expectations when it comes to tipping? Belize currency is the Belize dollar. It is fixed (pegged) to the US Dollar at a ratio of $2bzd to $1USD. You will find that you can use both currencies all over Belize. (US coins are NOT accepted in Belize) For more tips and information - and how to prepare for your trip money-wise, see this post.
- Can I drink the water on Ambergris Caye? Technically you can but most people don't. It just can sometimes have a bit of a salty taste to it - it is made thru the desalination process. Bottled water is plentiful and affordable and while I brush my teeth and wash my face (and veggies) with tap water, I drink bottled water.
- Is Belize safe? I think you will feel safe on Ambergris Caye but you want to take some basic precautions - especially if you are a woman traveling solo. I have written an article with some suggestions and things to think about when traveling.
- What is the "dress code" on Ambergris Caye? What do I need to pack? Unless you are attending a destination wedding on the island (one with a dress code!) - you can keep it very casual on your trip to Ambergris Caye. Very. Flip-flops and shorts, tank tops and bathing suits are really the essential clothing for your trip. I'd suggest bug spray (some months we have bugs, some months we have none) and lots and lots of SPF. Here is my packing list for some suggestions.